September 2026 Kansas City Housing Market: What the July Data Tells Us
Kansas City home prices rose 3.9% year over year in July 2026, with the metro median sale price at $349,900. Inventory is still tight at 2.6 months of supply, closed sales are up 5.1%, and mortgage rates hover near 6.76%. Here is what that means for buyers, sellers, and investors this September.
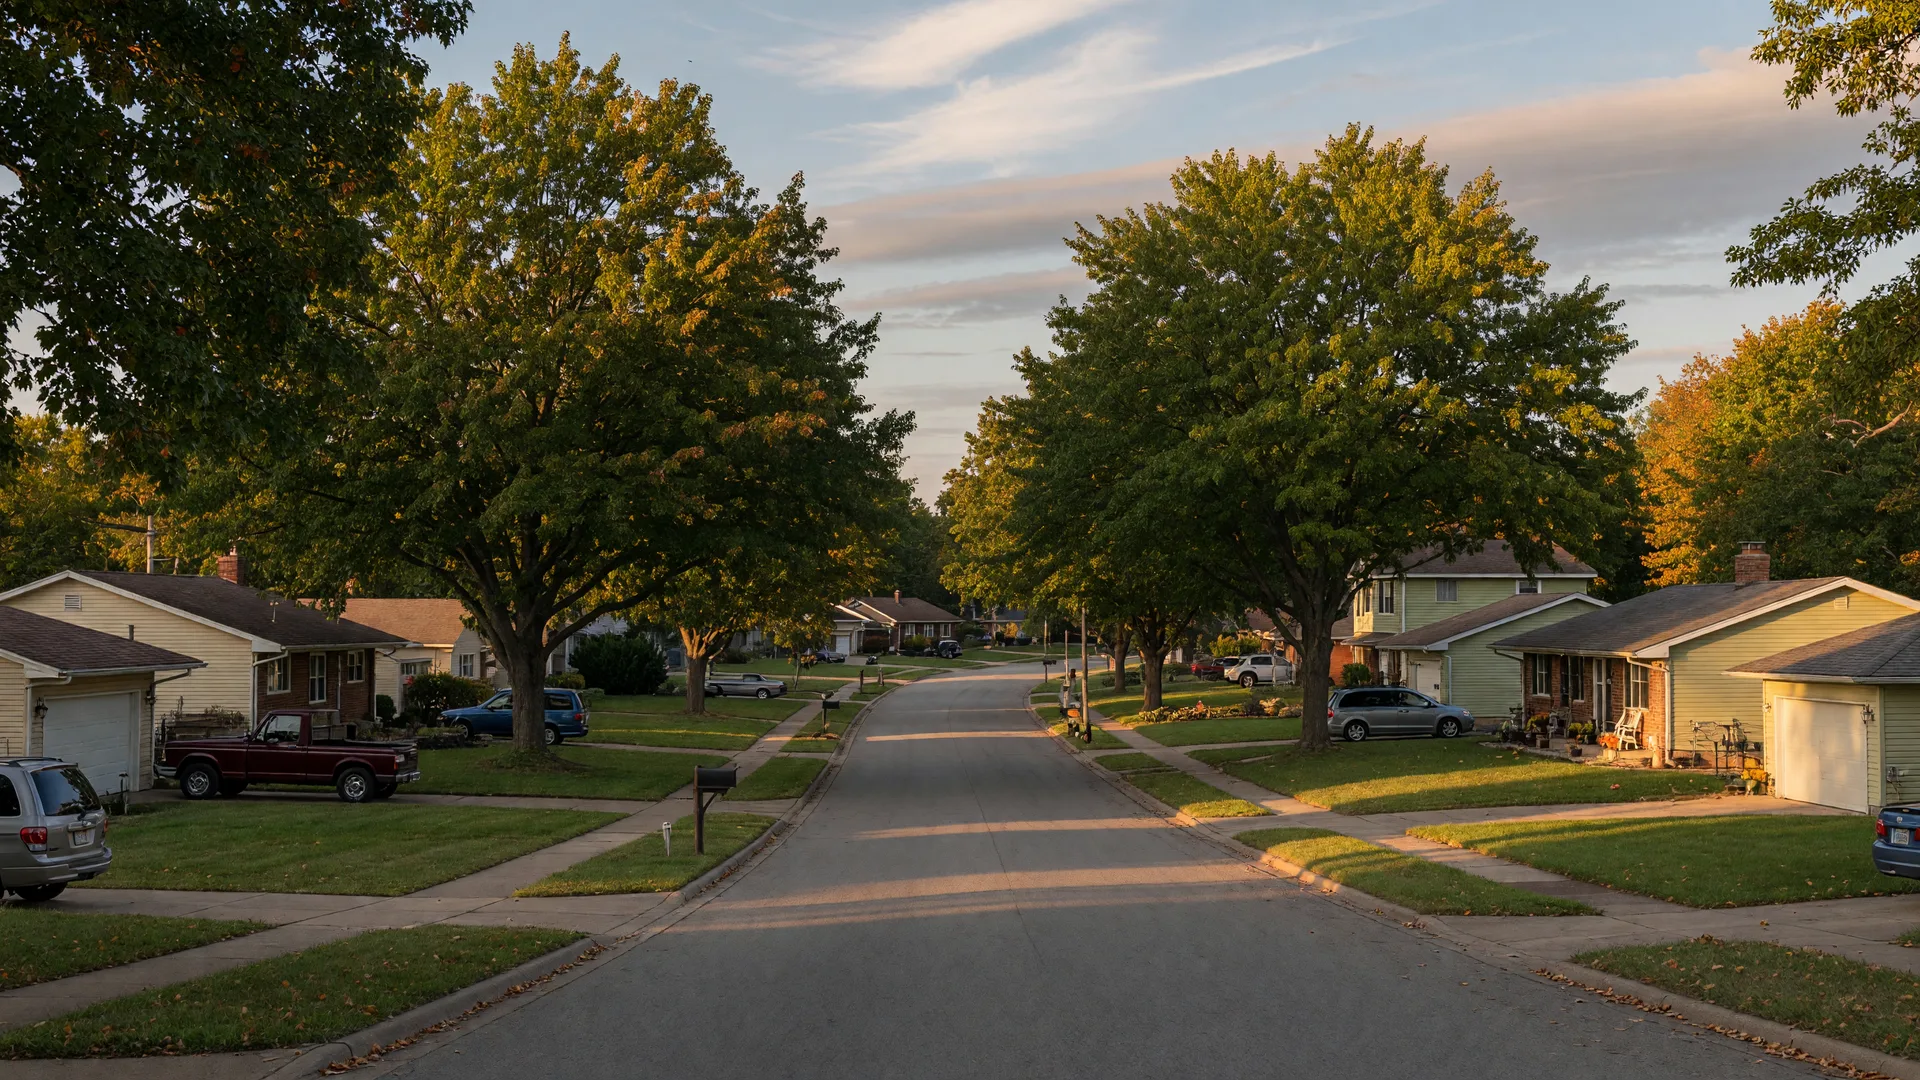
The Kansas City Housing Market Heading into Fall 2026
If you are wondering what is happening in the Kansas City housing market right now, the short answer is steady price growth with supply that is still tight. July 2026 data from the Kansas City Regional Association of REALTORS (Heartland MLS), the most recent complete reporting period available, shows a metro that remains tilted toward sellers. Prices are climbing at a moderate pace, closed sales are up year over year, and mortgage rates near 6.76% continue to shape who can buy and what they can afford.
This September 2026 update uses July 2026 figures because that is the newest complete month of market data published by KCRAR and Heartland MLS as of mid-September. We will refresh this page each month as new reports are released. Whether you are buying your first home in Kansas City, selling your current property, relocating from out of state, or building new construction, here are the numbers that matter for your next move.
Search Homes in Kansas City to see current listings and pricing in your target neighborhood.
July 2026 Kansas City Housing Market at a Glance
Here are the headline numbers for the Kansas City metro area based on Heartland MLS data for July 2026, the most recent complete month available at the time of this update.
Median Sale Price
$349,900
Up 3.9% year over year; existing-home median $332,000
Average Sale Price
$406,907
Up 2.5% year over year
Active Inventory
~8,258 homes
Down about 5% from July 2025
Months of Supply
2.6
Below 5-6 months indicates a seller's market
Avg Days on Market
36
Up slightly from a year ago
Sale-to-List Ratio
98.1%
Average sale price relative to original list price
Sales Activity in July 2026
Closed sales reached 3,572 in July, up 5.1% from 3,399 a year earlier. Year-to-date closings through July totaled 20,648, up 5.3% from the same period in 2025. Pending sales tell a two-speed story: existing-home pending sales were down 8.9% year over year, while new construction pending sales rose 10.5%, a clear sign that builder incentives are drawing buyers.
What These Numbers Mean for You
Statistics only help when you understand what they mean for your specific situation. Here is how to interpret the July 2026 Kansas City market data.
Price Growth Is Moderate, Broad, and Steady
A 3.9% year-over-year gain in the metro median is healthy and sustainable, not the double-digit surge of 2021-2022 and not a decline. Growth is also broad across the metro: Johnson County is up 5.3%, Jackson County is up 6.8%, and Clay County is up 4.7%. For sellers, your home is still appreciating, but pricing it realistically matters more than it did a few years ago. For buyers, waiting another year likely means paying more for the same home, so the longer you wait, the more the entry price moves up.
Inventory Is Still Tight, and It Shrank over the Past Year
At 2.6 months of supply, we are firmly in seller's market territory (a balanced market is 5-6 months). Active inventory of roughly 8,258 homes is down about 5% from July 2025, so the supply problem has not gone away. Buyers have more choices than in the extreme years of 2022, but well-priced homes in good condition still sell quickly. The 36-day average days on market confirms that the homes moving fastest are the ones priced and presented well the first time.
Mortgage Rates Are the Real Wild Card
The 30-year fixed mortgage rate averaged 6.76% for the week ending September 10, 2026, up from 6.71% the prior week, according to Freddie Mac's Primary Mortgage Market Survey. The 15-year rate averaged 6.09%. When rates sit near 6.75%, monthly payments are roughly 25-30% higher than they were for buyers who locked in near 5% a couple of years ago. That pressure shows up in the data: existing-home pending sales fell 8.9% year over year in July while new construction pending sales rose 10.5%, in large part because builders are using rate buydowns and incentives to soften the monthly payment. The Federal Reserve's policy decision lands September 16, and markets entered that meeting expecting a possible quarter-point rate hike, so watch this space.
Kansas vs. Missouri: Two Sides of One Market
One of the most important things to understand about the Kansas City housing market is that the Kansas and Missouri sides behave differently. Here is how they compare in the most recent data.
| Metric | Kansas Side (Johnson County) | Missouri Side (Jackson County) |
|---|---|---|
| Median Sale Price | $505,500 | ~$299,000 |
| YoY Price Change | +5.3% | +6.8% |
| Key Advantage | Top-rated schools, faster sales, higher entry price | Lower entry cost, more space per dollar, faster price growth |
Source: Heartland MLS via eMetropolitan, July 2026, for Johnson County. Jackson County figure is Redfin's rolling median for the three months ending July 2026. Johnson County includes Overland Park, Olathe, Leawood, and Shawnee. Jackson County includes Kansas City (MO), Independence, Lee's Summit, and Blue Springs.
Northland, Liberty, Parkville & Key Submarkets
Kansas City is not one market, it is dozens of micro-markets. Submarket figures below come from Redfin's three-month rolling snapshot ending July 2026 unless noted. Here is what the data shows across the areas we serve most.
Northland (Platte & Clay Counties)
Clay County's median sale price came in around $348,000, up 4.7% year over year, keeping the Northland solidly in seller's market territory. Platte County's year-to-date median through the first half of 2026 stood at $425,000, according to Heartland MLS data released in July. Ongoing new construction along the I-29, I-435, and 152 corridors continues to attract families who want newer homes close to the airport, downtown, and growing employment centers. The Northland still offers more house for the dollar than Johnson County while feeding strong school districts like Park Hill and Kearney.
Liberty (Clay County)
Liberty's median sale price was approximately $370,000, up about 1% year over year, with steady buyer demand across price points. The Liberty school system continues to draw families, and the mix of a historic downtown with newer subdivisions keeps the market active from starter homes into the $500,000-plus range. Price growth has slowed here relative to the metro, which can open negotiating room for buyers who are patient.
Parkville & Platte County
Parkville's median sale price was approximately $580,000 over the three months ending July 2026, essentially flat year over year, while price per square foot rose about 2.3%. Parkville's riverfront downtown and nearby new communities along the I-29 corridor make it a sought-after circuit for buyers who want character and newer construction. Its price point is the highest of the Northland areas we track, so positioning and presentation matter most there.
Overland Park (Johnson County, KS)
Overland Park's median sale price was approximately $530,000, up 2.9% year over year, with homes selling in about 7 days and Johnson County overall at $505,500 with a 5.3% gain and 29 days on market. Blue Valley and Shawnee Mission schools, strong amenities, and easy highway access keep demand steady, though the higher entry price filters out some buyers in this rate environment. Well-priced, well-presented homes in Overland Park still move fast.
Lee's Summit (Jackson County, MO)
Lee's Summit posted the fastest price growth of the submarkets we track, with a median sale price around $421,000, up 12.1% year over year, alongside a days-on-market figure near 41 per local market data. The Lee's Summit school district is a top draw, and the mix of established neighborhoods and newer communities gives buyers options across price ranges. Strong demand and constrained resale inventory keep this one of the Missouri side's most competitive markets.

Understanding the numbers is easier with a local advisor who knows your target neighborhood.
Is Now a Good Time to Sell a House in Kansas City?
Based on July 2026 data, the answer is yes for most Kansas City homeowners, but the strategy looks different than it did two or three years ago. Here is what sellers should know heading into September and October.
Why the Market Still Favors Sellers
With 2.6 months of supply and closed sales up 5.1% year over year, conditions are still tilted in favor of sellers. Prices are up 3.9% metro-wide, so most homeowners have built meaningful equity, and the average home sells in 36 days, far faster than the 60-90 days typical of a balanced market. The average sale price of 98.1% of original list means the gap between asking price and final sale is small for homes priced correctly.
What Has Changed for Sellers in 2026
- Pricing matters more. Overpriced homes sit longer, and with 36 average days on market, the window for a strong first offer closes fast.
- Condition and presentation are differentiators. Buyers are more selective at today's prices and rates, so staging and small repairs pay off.
- Seller concessions (rate buydowns, closing cost assistance) can bridge the affordability gap for buyers and keep your sale on track in a 6.75% rate environment.
- If you also need to buy your next home, coordinating a sale and purchase takes careful timing. Options like buy-before-you-sell programs, bridge financing, and contingent offers are worth exploring with an advisor who has done it many times.
Get a personalized home value estimate and selling strategy from Jason and Jana.
What Buyers Should Know in the September 2026 Market
Buying a home in Kansas City this September is possible with the right preparation. Here are the key factors that define this market for homebuyers.
The Affordability Equation
The combination of rising prices and mortgage rates near 6.76% means monthly payments are higher than a year ago. On a $349,900 median-priced home with 20% down and a 30-year fixed loan at 6.76%, the monthly principal and interest payment is roughly $1,815, about $140 more per month than the same home financed at 6%. That kind of difference matters over the life of a loan, which is why buyers are comparing builders' rate buydowns and lender credits more aggressively than ever.
Strategies That Work Right Now
- Get pre-approved before you shop. Sellers and listing agents take pre-approved buyers more seriously in a market where financing is the riskiest part of the deal.
- Consider new construction with builder incentives. New construction pending sales rose 10.5% year over year in July while existing-home pendings fell, and builder rate buydowns are a big reason why.
- Explore the Missouri side for better value. Jackson County's roughly $299,000 median buys significantly more home than Johnson County's $505,500 median, and its prices are growing faster on a percentage basis.
- Look at homes that have been on the market 30-plus days. With a metro average of 36 days on market, listings that have lingered may offer negotiating room.
- Ask about closing cost assistance and down payment programs. First-time homebuyer programs in both Kansas and Missouri can reduce your upfront costs significantly.
Search available homes or schedule a buyer consultation to discuss your options.
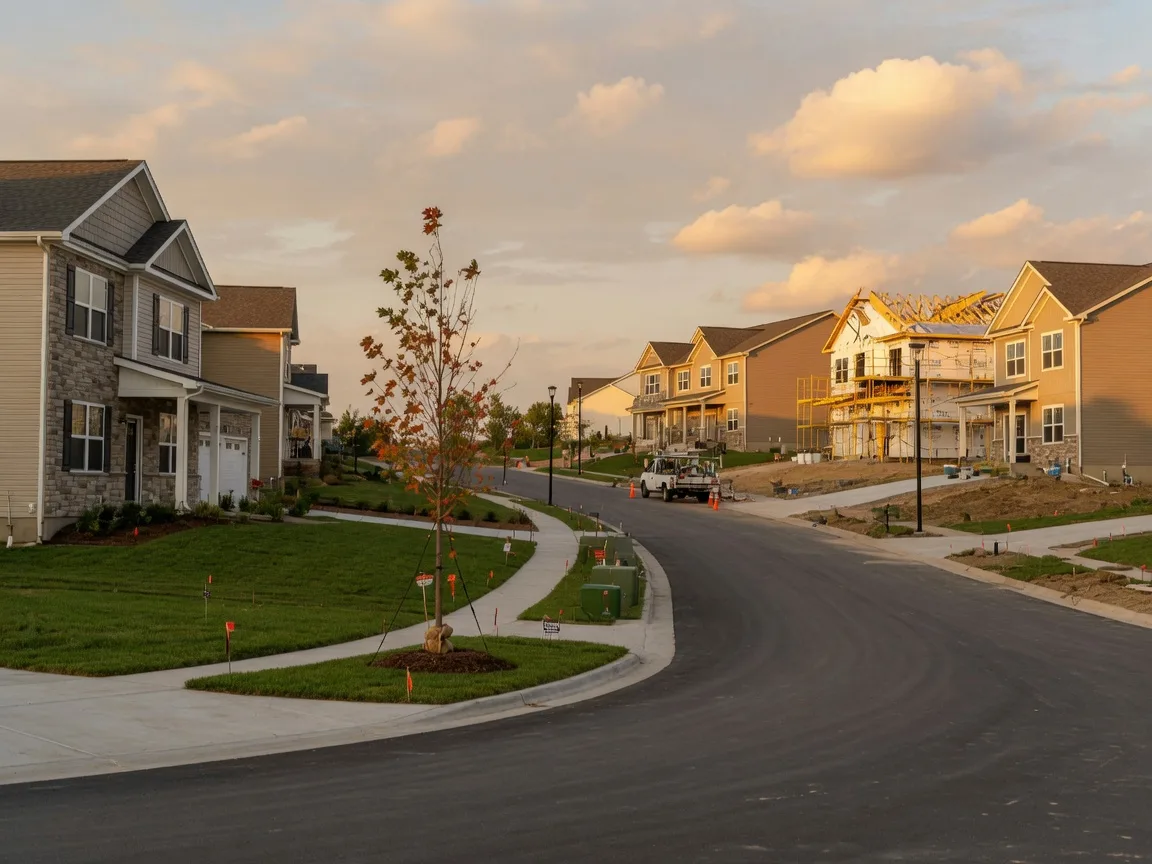
New construction with builder incentives continues to draw buyers in the Northland, Platte County, and Johnson County communities.
Not sure how these numbers apply to your home, your budget, or your timeline? Jason and Jana DeLong of Heartland Homes KC can show you what the September 2026 Kansas City market means for your specific situation.
Kansas City Housing Market Outlook: September to November 2026
Looking ahead to the next 30 to 60 days, here is what we expect for the Kansas City market.
- The Fed decision is the near-term trigger. The Federal Reserve's rate decision lands September 16, with markets pricing in a possible quarter-point hike as of mid-September. An actual hike would put renewed upward pressure on mortgage rates; a hold would likely let them drift sideways around 6.6-6.8%.
- Steady price growth, modest seasonal slowdown. We expect metro prices to keep rising 3-4% year over year through the fall, with listing activity cooling after the summer peak. Homes that are priced and presented well will still sell quickly; average properties may take longer.
- New construction keeps carrying the market. With new construction pending sales up 10.5% year over year in July, builders in the Northland, Platte County, and Johnson County are using rate buydowns, lender credits, and quick move-in inventory to convert buyers that resale listings are losing on affordability.
- Watch the split between existing and new homes. If existing-home pending sales keep falling while builders' order books stay strong, expect sellers of resale homes to lean harder on concessions and sharp pricing through the fall.
Frequently Asked Questions About the Kansas City Housing Market
Quick answers to the questions we hear most from Kansas City buyers, sellers, and homeowners.
Is the Kansas City housing market going to crash in 2026?
There is no evidence of a housing crash in the Kansas City market. Prices are rising at a moderate 3.9% annual pace, inventory is still low at 2.6 months of supply, and closed sales are up 5.1% year over year through July 2026. A price decline would require a sudden surge in inventory, a sharp spike in unemployment, or a major credit tightening. None of those conditions are present in the current data.
Is now a good time to buy a home in Kansas City?
It depends on your personal situation. If you need a home and can manage the monthly payment at current rates, buying now lets you lock in a price before further appreciation. At the current 3.9% growth rate, a $349,900 median-priced home could cost roughly $363,500 a year from now. Waiting for rates to fall carries the risk that prices rise faster than any rate improvement. New construction with builder incentives can be a strong middle path for buyers who want to manage both price and rate.
What is the average home price in Kansas City in 2026?
As of July 2026, the median home price in the Kansas City metro is $349,900 and the average sale price is $406,907, per Heartland MLS data. Prices vary widely by submarket: Johnson County's median is around $505,500, Jackson County's is roughly $299,000, and Clay County's is about $348,000.
Are home prices dropping in Kansas City?
No. Home prices in the Kansas City metro rose 3.9% year over year in July 2026, and both the Kansas side and the Missouri side were up. Some individual properties reduce their asking price, which is normal in any market, but the overall trend is upward. Reductions typically happen when a home is initially overpriced, not as a sign of a market-wide decline.
What are mortgage rates in Kansas City right now?
The 30-year fixed mortgage rate averaged 6.76% for the week ending September 10, 2026, and the 15-year rate averaged 6.09%, according to Freddie Mac's Primary Mortgage Market Survey. Actual rates in Kansas City vary based on your credit score, down payment, loan type, and any rate buydown or discount points. Builder incentives in new construction communities can include temporary rate buydowns that lower your payment for the first one to three years.
Should I buy on the Kansas side or Missouri side of Kansas City?
The Kansas side (Johnson County) offers top-rated school districts, faster sales, and high demand, but at a significantly higher entry price (about $505,500 median). The Missouri side (Jackson County and the Northland) offers more home for your money (roughly $299,000 to $348,000 medians), still-solid appreciation, and, in Jackson County, faster percentage price growth. Your choice depends on your budget, school priorities, commute, and lifestyle goals. This is exactly the kind of decision a local advisor can help you weigh.
Is it a buyer's market or seller's market in Kansas City right now?
The Kansas City metro remains a seller's market with 2.6 months of supply as of July 2026; a balanced market is typically 5-6 months. The new construction segment is especially active, with pending sales up 10.5% year over year, while existing-home pending sales were down 8.9%. Negotiating room varies by price point and neighborhood, so it is worth asking your agent where your target range stands before you write an offer.
How long do homes stay on the market in Kansas City?
The metro average was 36 days on market in July 2026, up slightly year over year. Some submarkets move faster: Overland Park homes sell in about 7 days on average, Johnson County overall averages 29 days, while Lee's Summit listings sit near 41 days. A home that has been listed for 30-plus days is often a candidate for a realistic offer or a price adjustment.
Understand Your Next Move in Kansas City
Every market update is useful, but what matters most is how the data applies to you. Whether you are buying your first home, selling a property you have owned for years, relocating to the Kansas City metro, or exploring new construction options, the right strategy depends on your specific goals, timeline, and financial situation.
Jason and Jana DeLong combine more than 25 years of experience in architecture, construction, renovation, and real estate to help Kansas City families make smarter decisions. We help our clients compare builders, evaluate floor plans and lots, understand true costs including incentives and financing, coordinate the sale of their current home, and manage the entire process from lot selection to final walkthrough.
Discuss timing, pricing, neighborhoods, builder incentives, and your complete move plan with Jason and Jana.
More Market Insights and Articles
Browse our library of market updates, new construction guidance, and resources for Kansas City buyers and sellers.
New Construction Costs Explained
What the base price does not include: lot premiums, upgrades, landscaping, and closing costs.
How to Choose the Right Builder
What to look for when comparing home builders in Kansas City.
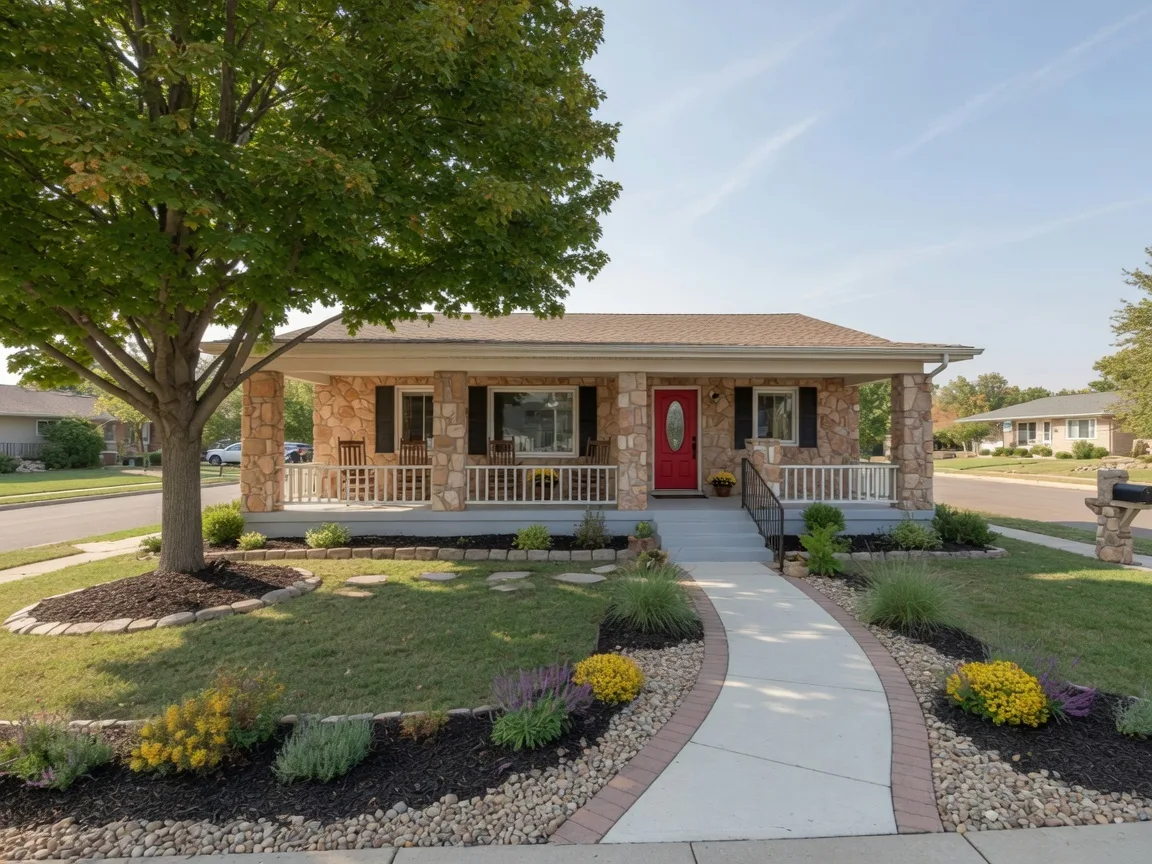
Downsizing in Kansas City
A complete guide to moving to a smaller home in Kansas City.
Get a Personalised Market Update for Your Situation
Let us help you understand your home value, buying power, or selling strategy based on real July 2026 Kansas City market data. Call us, schedule a consultation, or request a free home value review.